April New Car Registrations Up 11% but down 8.5% year to date
The Society of the Irish Motor Industry (SIMI) today issued the new vehicle registrations statistics for April along with their Quarterly Motor Industry Review Q1 of 2019.
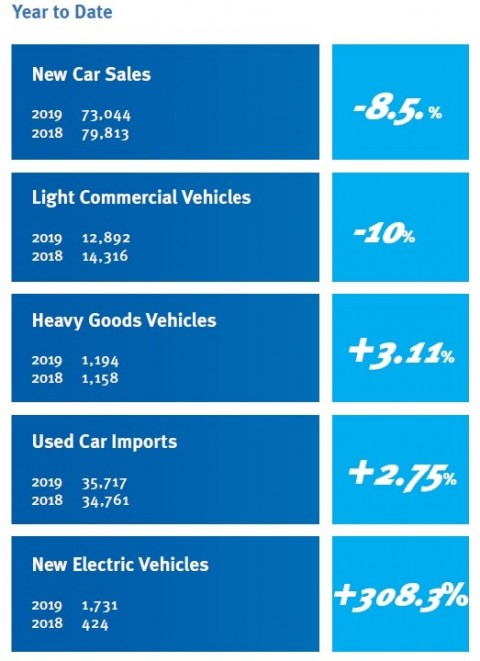
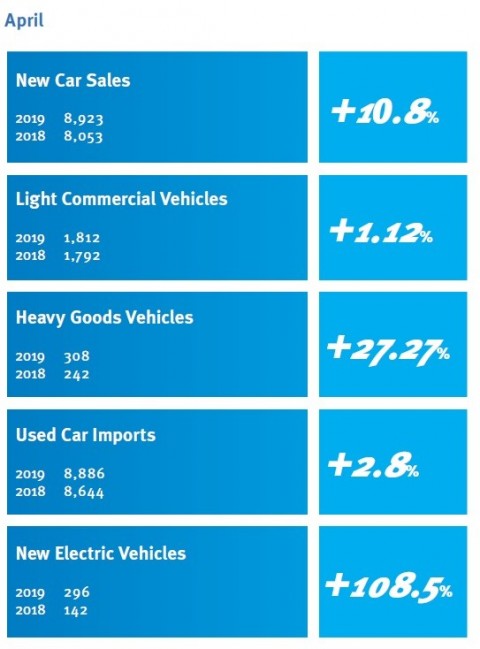
New car registrations for the month of April were up 11% (8,923) when compared to April 2018 (8,053). While new cars registrations year to date remain 8.5% (73,044) down on the same period last year (79,813).
New Light Commercial Vehicle registrations (LCV) were slightly up 1.12% (1,812) on April 2018 (1,792) and year to date are down 9.95% (12,892). While New Heavy Commercial Vehicles (HGV) have increased 27.27% for the month of April (308) compared to the same month last year (242) and are up 3.11% (1,194) year to date.
Imported Used Cars increased 2.8% for April 2019 (8,886) when compared to April 2018 (8,644) and year to date they are 2.75% (35,717) ahead of 2018 (34,761)
The SIMI Report shows that while the Irish economy is still positive, both new cars and commercial registrations, declined in the first quarter of 2019 with the exception of both electric cars and used car imports. External threats such as Brexit uncertainty, greater consumer caution and the ongoing growth of used imports continue to undermining new car sales. Another contributing factor is the increase in the VRT on new cars, arising from the fact that no allowance was made by the Irish authorities for the first step in the move to the new WLTP testing regime.

Brian Cooke Director General, SIMI commented: “This rise in new car registrations for the month of April is in reality a timing issue. Easter is a key period for car-hire business and with it falling later than usual in 2019, this pushed some car-hire that normally occurs in March into April. The real indication of the new car market environment is the year to date figures, which show a 8% decrease on last year. The outlook for the remainder of the year is still very uncertain for the Industry. Looking forward to 2020, with the next phase of the WLTP Testing due for implementation, it is vital for the Industry that any changes to taxation systems are flagged well in advance of their implementation date to allow the Industry plan their businesses in a normal and effective manner”.

Jim Power, Economist and author of the SIMI Report said: “It is still a challenging environment for consumer-facing businesses as the personal sector is pressurised due to a combination of high and rising housing costs, an onerous personal tax burden, subdued wage growth over the past decade, and Brexit is an overhanging dark cloud that is creating major uncertainty and caution in the psychology of consumers and businesses across the economy.”
2019 new car registrations are forecasted to reach around 112,000 which would represent a decline of 10.8% on 2018 while used car imports by contrast are projected to increase marginally to around 101,000. Similar to last year Brexit related uncertainty looks set to continue, largely due to the uncertain performance of sterling and the impact of used imports from the UK.
The SIMI Report also highlights the cost of motoring. The average price of a new car in Q1 2019 was 0.7% higher than a year earlier; interestingly consumers are spending more on higher specification cars with the average OMSP (Open Market Sales Price) up 3.9% on Q1 last year. The cost of Motor Insurance in March 2019 was 5.9% lower than it was a year earlier; while Motor Insurance costs since July 2016 have declined 23.8%. The cost of fuel increased in March 2019 with Petrol prices 0.2% higher and Diesel prices 5.5% higher than a year earlier.
The new cars sales fuel type in Q1 of 2019 is also changing with new diesel registrations accounted for 48.27% of the market a decline from 56.27% on quarter one last year while petrol accounted for 40.83% of the total up from 37.51% on Q1 of 2018. Average CO2 emissions for new cars sold were 1.5% higher in the first quarter of 2019 when compared to a year earlier. The recent move away from diesel to petrol has resulted in average CO2 emissions now trending upwards again after a prolonged period of desirable decline.
April Stats in Short
- New car sales year to date (2019)73,044 v (2018) 79,813 -8.5%
- New car sales total April (2019) 8,923 v (2018) 8,053 +11%
- Light Commercial Vehicles sales year to date (2019) 12,892 v (2018) 14,316 -10%
- Light Commercial Vehicles sales total April (2019) 1,812 v (2018) 1,792 +1.12%
- Heavy Goods Vehicle total sales year to date (2019) 1,194 v (2018) 1,158 +3.11%
- Heavy Goods Vehicle sales total April (2019) 308 v (2018) 242 +27.27%
- Used Car Imports year to date (2019) 35,717 v (2018) 34,761 +2.75%
- Used Car Imports total April (2019) 8,886 v (2018) 8,644 +2.8%
- Hire Car total year to date (2019) 12,459 v (2018) 11,459 +8.73%
- Hire Car total April (2019) 2,728 v (2018) 1,737 +57.05%
- Electric Vehicle sales year to date (2019) 1,731 v (2018) 424 +308.25%
- Electric Vehicles Car total April (2019) 296 v (2018) 142 +108.45%
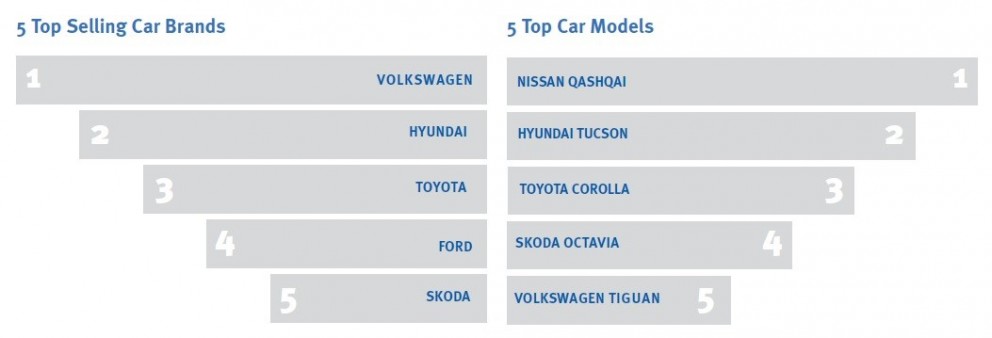
- 5 Top Selling Car Brands Year to Date were: 1. Volkswagen 2. Hyundai 3. Toyota 4. Ford 5. Skoda
- 5 Top car model’s year to date were: 1. Nissan Qashqai 2. Hyundai Tucson 3. Toyota Corolla 4. Skoda Octavia 5. Volkswagen Tiguan
- Top Selling Car April: Toyota Corolla
- Table below shows new car registrations by county year to date (January-April 2019)
SIMI Motor Industry Review Q1 2019
- 2019 forecast of new car sales 112,000 -10.8%
- New car registrations Q1 2019, totalled 64,076 +10.7% on Q1 2018
- New car market share Q1 2019 mix: Diesel 48.27%, Petrol 40.83%, Hybrid 7.7%, Electric 2.24%, Petrol/Plug-in Electric Hybrid 0.96%
- Imported Used Car registrations Q1 2019, totalled 26,832 +2.7% on Q1 2018
- C02 emissions Q1 2019 increase +1.5%
- €722.9 Million Exchequer contribution from car sales Q1 2019 -3.98% on Q1 2018
- Cost of Motoring: Average price of a new car +0.7%, Petrol prices increased +0.2%, Diesel prices increased +0.5% on March 2018, Insurance Costs in March 2019 -5.9% lower than March 2018. Average motor insurance costs in July 2016 -23.8% lower than March 2019.
- DOWNLOAD Motor Industry Review Q1 2019
|
New Car Registrations By County January-April 2019 |
|||||
|
County |
2019 Units |
2018 Units |
% Change |
2019 % Share |
2018 % Share |
|
Carlow |
815 |
1027 |
-20.64 |
1.12 |
1.29 |
|
Cavan |
785 |
839 |
-6.44 |
1.07 |
1.05 |
|
Clare |
1491 |
1780 |
-16.24 |
2.04 |
2.23 |
|
Cork |
9293 |
9983 |
-6.91 |
12.72 |
12.51 |
|
Donegal |
1546 |
1714 |
-9.8 |
2.12 |
2.15 |
|
Dublin |
30302 |
31789 |
-4.68 |
41.48 |
39.83 |
|
Galway |
2736 |
3037 |
-9.91 |
3.75 |
3.81 |
|
Kerry |
1482 |
1740 |
-14.83 |
2.03 |
2.18 |
|
Kildare |
2797 |
3429 |
-18.43 |
3.83 |
4.3 |
|
Kilkenny |
1409 |
1573 |
-10.43 |
1.93 |
1.97 |
|
Laois |
900 |
1011 |
-10.98 |
1.23 |
1.27 |
|
Leitrim |
254 |
323 |
-21.36 |
0.35 |
0.4 |
|
Limerick |
2568 |
2887 |
-11.05 |
3.52 |
3.62 |
|
Longford |
333 |
407 |
-18.18 |
0.46 |
0.51 |
|
Louth |
1743 |
1803 |
-3.33 |
2.39 |
2.26 |
|
Mayo |
1277 |
1412 |
-9.56 |
1.75 |
1.77 |
|
Meath |
2106 |
2450 |
-14.04 |
2.88 |
3.07 |
|
Monaghan |
585 |
645 |
-9.3 |
0.8 |
0.81 |
|
Offaly |
816 |
1027 |
-20.55 |
1.12 |
1.29 |
|
Roscommon |
643 |
706 |
-8.92 |
0.88 |
0.88 |
|
Sligo |
681 |
737 |
-7.6 |
0.93 |
0.92 |
|
Tipperary |
2027 |
2305 |
-12.06 |
2.78 |
2.89 |
|
Waterford |
2083 |
2205 |
-5.53 |
2.85 |
2.76 |
|
Westmeath |
1023 |
1124 |
-8.99 |
1.4 |
1.41 |
|
Wexford |
1814 |
2071 |
-12.41 |
2.48 |
2.59 |
|
Wicklow |
1535 |
1789 |
-14.2 |
2.1 |
2.24 |